ANALYSIS: By Crosbie Walsh
Have you ever noticed, when percentages are used in the print media in reporting political polls, that they almost never add up?
I think this is due to three practices:
- Only some of the results are published,
- Don’t know/Refused to Answer are seldom published or included in totals, and
- the effects of “rounding.
This would not happen if the media used tables to show percentages, and if Colmar-Brunton, which conducts polls for 1News, and Reid for Newshub, immediately released the poll.
Instead, they wait until 48 hours after the media has published the results.
So, use tables. They would show the complete results, and in most cases be easier to understand than the efforts of journalists to report them in text alone.
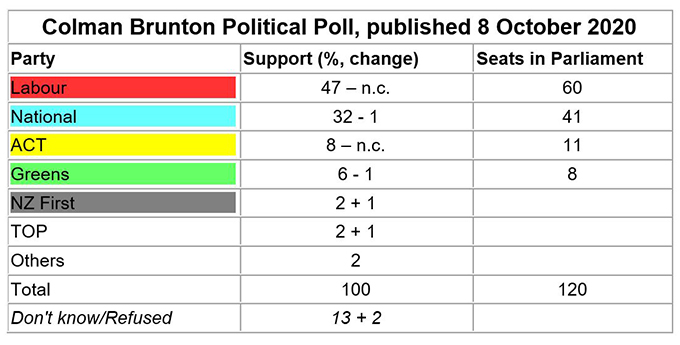
Here’s a topical example. Note especially note 2:
Note 1: Poll taken between 3-7 October 2020. n = 1005. Margin of error ± 3.1%.
Note 2: Don’t know/Refused to Answer who accounted for 130 of those polled were excluded from the party totals which should, therefore, be reduced to total 874, not the 1005 stated..
Note 3: Context. The third Leaders Debate, concerns about NZ First finances and supposed internal divisions within National occurred during this poll period.
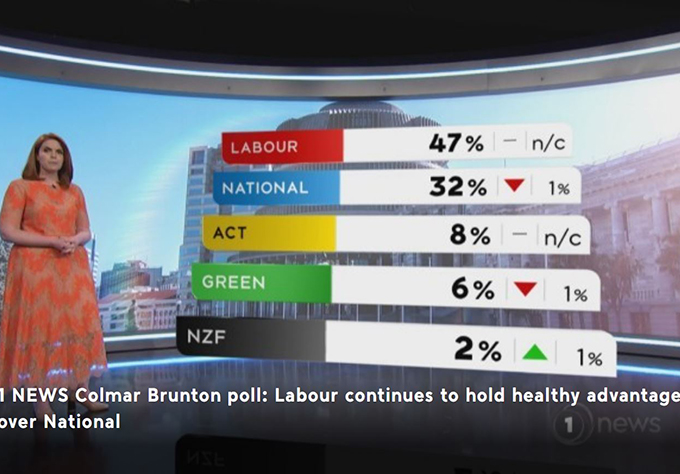
Graphs could also be used, and they sometimes are, to good effect but graphs are picture summaries of tables, and conceal whether or not the percentages total one hundred.
Margins of error and weighting
The media usually publish poll margins of error but make no effort to explain their importance. Indeed, they often comment enthusiastically about results that have absolutely no significance, making for misleading information.
The margin of error in most 1News/Colmar Brunton and Newshub/Reid polls is usually ± 3.1 percent. That means for a party that had 50 percent of the vote the actual result would be between 46.9 and 53.1 percent. But for a party with 10 percent of the vote the margin of error is much lower, ± 1.9 percent, and for a party with 5 percent, ± 1.4 percent.
What this usually means is that with the exception of Labour and to a lesser extent National, the results for all the other parties are statistically insignificant. They could all have occcurred by chance.
Similar results over several polls makes low scoring results look more plausible, but minor changes between polls are unworthy of comment.
ACT’s recent increased support to 8 percent and the Greens steady on over the critical 5 percent threshold to get into Parliament are certainly worth a comment but not the minor inter-poll changes for the other small parties.
One other poll method practice is weighting. To make random polls of about 1,000 people accurately reflect the actual compositon of our population in terms of sex, ethnicity, region and landline cellphone access, some of the poll’s composition will be increased and another reduced.
For example, if women are underpresented in the poll, weighting increases the proportion of women and reduces the proportion of men.
It is important to remember this, especially when looking at lower percentages.
Finally, polls take place over several days when other things are happening that could influence how the people polled responded. Context is very important.
Different contexts over different polls could be the “swinging factor” and not other supposed differences over time. The media should always note these happenings, and seldom do.
Dr Crosbie Walsh is a retired founding development studies professor at Massey University and the University of the South Pacific, and a blogger on Pacific affairs. The Pacific Media Centre collaborates with Dr Walsh.


